How To Use JMeter for PostgreSQL Database Performance Load Testing
Imagine this. You’ve developed your own website or mobile application with an awesome design and a whole bunch of cutting edge features. “It’s going to blow the market!”, you think. Time drags on as you’re counting down minutes till the launch date. The long-anticipated moment comes and the website is in production. Finally! However, instead of praising feedback and review articles on Techcrunch, you get dozens of messages from your customers saying they can’t complete their purchases/download images/find the necessary item/etc. So what happened?
In short, situations like that happen when your website or mobile application haven’t been properly tested. You can read about the importance of testing in our previous articles.
There are many types of testing that allow developers and Quality Assurance engineers make your website or mobile application more stable and reliable. Today, however, we’re going to talk about web testing, elaborating on specific tools that are used in our company. We’ll share our experience in working with JMeter and how we use it for database load testing (in this case, it’ll be PostgreSQL). Every challenge described here was solved during one of our project’s implementation.
But what is JMeter? In plain words, it’s a tool that can be used for both performance and load testing of your website.
In one of our projects, we needed to monitor the database parameters responsible for the API work. We used JMeter, which we run from the command line, as our main tool. The testing results were outswaped in the CSV format and automatically loaded in an admin panel. Graphs of the testing results were built according to these results.
To start working with jMeter, follow this link and install it. If you already have JMeter, make sure that you have the latest version. Then, install Plugins Standard set. The last step is to get the JDBC driver for working with PostgreSQL that you can find here. The downloaded driver’s jar file should be copied to a folder [jmeter directory]/lib. Now you’re ready to start creating a test scenario.

For this scenario, we chose the selection’s prestored queries (SELECT) processed by calling the API methods on the client side. This queries pool is processed by Random Controller (each time, it chooses a random/spontaneous one from the request set). In the context of JMeter components, request is a component of JDBC Request.
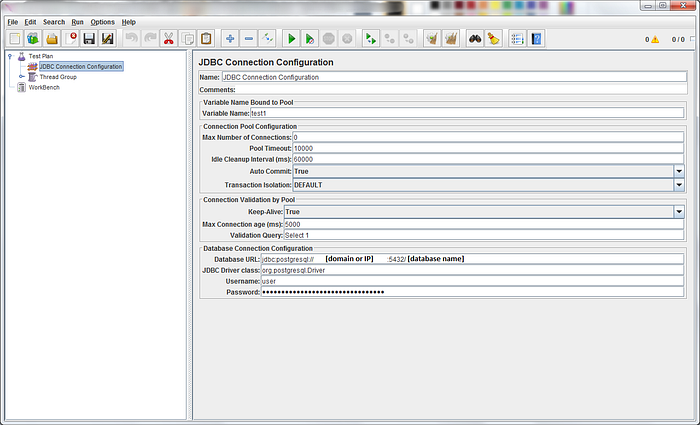
The first step is setting the connection with a database in the JDBC Connection Configuration component. Filling the component’s field can remained unchanged as we are working only with the Database Connection Configuration section. We need to add the following:
- Database URL, databases storage location (domain name or IP address) along with indicating a port and database name — jdbc:postgresql://[host name or IP]:[port]/[database name];
- JDBC Driver Class — the driver class being used. In our case, it’s org.postgresql.Driver;
- Username;
- Password;
And don’t forget to save all the changes in the scenario.

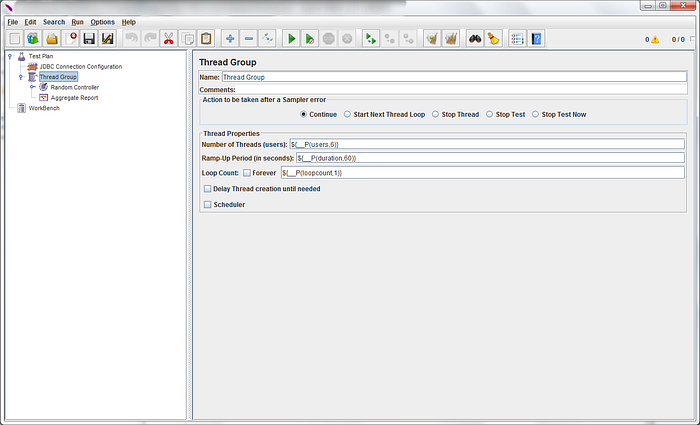
The next element is a Thread Group. It should be on the same level with the JDBC Connection Configuration.
Usually, we define the following values in the settings of Thread Group:
- We send 60 users — Number of Threads (Users) = 60;
- within 60 seconds — Ramp-Up period (in seconds) = 60;
- We repeat it 5 times — Loop count = 5.
Our test lasts for 5 minutes. We send about 300 of requests (60 requests per minute). However, we work without UI. JMeter runs with the parameters from the command line. For this purpose, the following construction is used (instead of numerical values): ${__P([parameter name],[default value])}. For example:
- in Number of Threads (Users) we assign ${__P(users,6)};
- in Ramp-Up period (in seconds) we assign ${__P(duration,60)};
- in Loop count we assign ${__P(loopcount,1)}.
We save all the changes and use these parameters in the command line the following way:
[jmeter-directory]/jmeter -n -t [path]/[jmeter-scenario-file-name].jmx -Jusers=5 -Jduration=60 -Jloopcount=3 -l [path]/[report-file-name].jtlAs you can see from the example above, the letter “J” is added to the beginning of each parameter’s name. We have in the scenario: users, duration, loopcount. In the command line they should be listed as Jusers, Jduration, Jloopcount.
The next element added to the test scenario is “Random Controller.” It should be added as a child Thread Group object. The two things to be configured here are the component and the comment.
We add a Listener component on the same level with Random Controller. In our task, it is the Aggregate Report.

The final step in creating the scenario is adding the requests. In JMeter components terminology they’re known as JDBC Request. As we’ve mentioned, for solving application-oriented tasks, we choose prestored queries that work when calling API projects methods. It’s possible to work with any type of requests (not limited to SELECT set). In our task, we used only selections.
In practice, you shouldn’t use a lot of JDBC Request as it decreases the chance of a repeated call of some request during a single test session. It’s important to call a request at least a several times. Usually, the first selection is much slower than the next ones. And if there’s only one selection, the results of the response time (request processing) are very corrupted.
We need to add at least 5 and at most 20 JDBC Request with various requests (in our case it’s only SELECT). All JDBC Request must be added as child objects to the Random Controller.

Let’s look at the fields of the JDBC Request component. In our example, we used only selections; in other words, the Query Type was Select Statement. Additionally, there are Update Statement (adding and removing), Callable Statement (for calling the stored procedures), Prepared Select Statement (prepared and parameterized selection), Prepared Update Statement (prepared/parameterized request of adding and removing), Commit (save the changes), Rollback (rolling back the changes), Autocommit (false) (cancel of automatic changes saving), Autocommit(true) (automatic saving the changes), and Edit (should be a link to a variable that accepts a value from the items above).
A static request can be placed in the field Query. It can also be a request, which is more interesting in terms of loading creation where all the parameters are constantly changing. For example, It can be an ID selection. We know the ID range of objects in which we’re interested is from 1 to 2036. That’s why, it is better to use a function _Random in the request, such as:
SELECT “organizations”.*FROM “organizations”WHERE “organizations”.”id” = ${__Random(1, 2036)}
Using Parameters values, we can assign parameters value. In the Query’s field the parameters are specified as a question mark. In the field Parameter types, we can assign types of the parameters. Both the parameters and type of the parameters are specified with a comma. For example, we’ve a request:
SELECT “organisations”.*FROM “organisations”WHERE “organizations”.”id” = ?AND “organizations”.”city” = ?
In this case, in the Parameter values field we can add: 10, London. Consequently, in the field Parameters types, we add: INTEGER, VARCHAR. In the field Parameter values, we also can use the function _Random to add variety to selections.
The field Variable names allows assigning a list of variables for saving the data that return JDBC Request (as an item separation, the symbol used is “comma”).
If the “Result variable name” field is assigned a value, it creates a variable Object with a list of lines maps. Each map has the name of field as a key and column data as a value. Here’s an example of how to use it:
columnValue = vars.getObject(“resultObject”).get(0).get(“Column Name”);The Query timeout (s) has nothing unusual. As soon as the value is assigned, there is a deference in the request.
This field Handle ResultSet is used for work with the stored procedures Callable Statement and determines the way the result will be processed:
- Store As String (default) — variable values are saved in the lists in terms of lines;
- Store As Object — variables are saved as the object;
- Count Records — all the records are counted and variables saved as lines
Now we have a scenario, and we can run JMeter in the command line. Nevertheless, we get a report in the jtl format when we need csv for converting the data collected by Aggregate Report. In csv we need one of the plugins from Plugins Standard set. This plugins is also known as CMDRunner. We need to run JMeter:
[jmeter-directory]/jmeter -n -t [path]/[jmeter-scenario-file-name].jmx -Jusers=5 -Jduration=60 -Jloopcount=3 -l [path]/[report-file-name].jtlThe next step is to convert jtl to csv as follows:
java -jar [jmeter-directory]\lib\ext\CMDRunner.jar — tool Reporter — generate-csv [path]/[aggregate-report-file-name].csv — input-jtl [path]/[report-file-name].jtlThe type of slash and the directions depends on the operating system.
The Bottom Line
Through our efforts, we have a product allowing the collection of parameters through the database. In the control pad, all the information is presented in terms of graphs.


In summary, let’s look at the main advantages of JMeter:
- It’s very flexible. You can customize JMeter and apply the automation testing to JMeter.
- JMeter supports various protocols including FTP, HTTP, SOAP, JDBC, JMS, and LDAP.
- As we’ve already mentioned, JMeter is open source and can be downloaded free of cost.
- It’s really simple to use. All you need to do is to download it, install, and run!
Through our own experience, JMeter is cool software that will make you fall in love with testing your web application.
Hopefully, our experience in testing will stand you in good stead. If so, subscribe to our blog and stay tuned!
